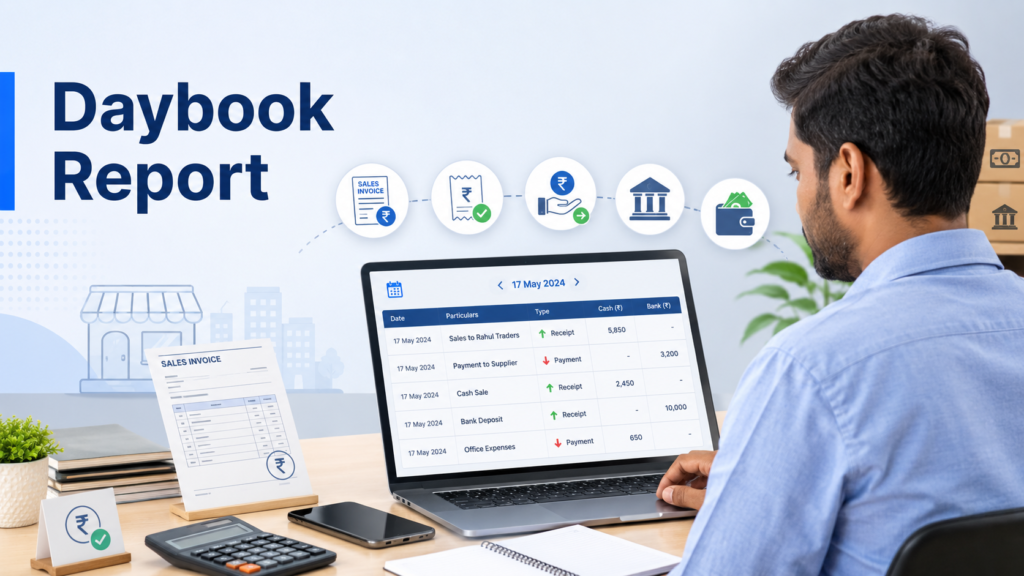
Daybook Report: Meaning, Format, Example and Uses
Learn what a daybook report is, its format, entries, examples, uses, and differences from ledgers and cash books for Indian small businesses.
Read posts on Accounting
Learn what a daybook report is, its format, entries, examples, uses, and differences from ledgers and cash books for Indian small businesses.
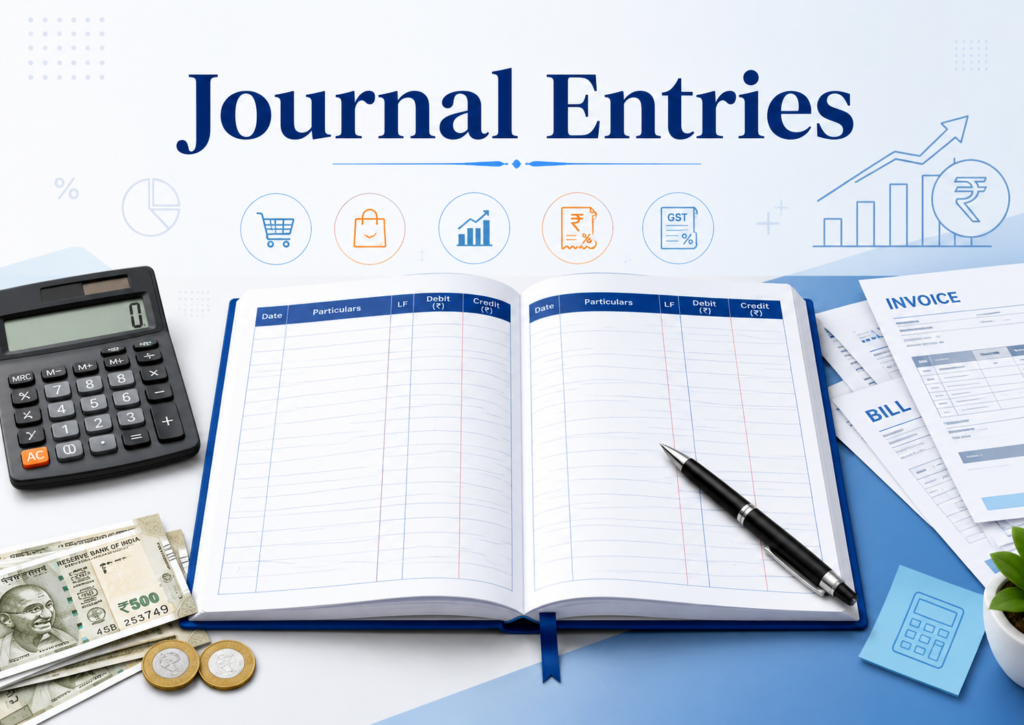
Learn what journal entries are, their format, debit and credit rules, types, and practical examples for Indian businesses, including GST transactions.

Learn what small business owners can manage through a mobile accounting app, from GST invoices and expenses to stock, payments, reports, and CA sharing.
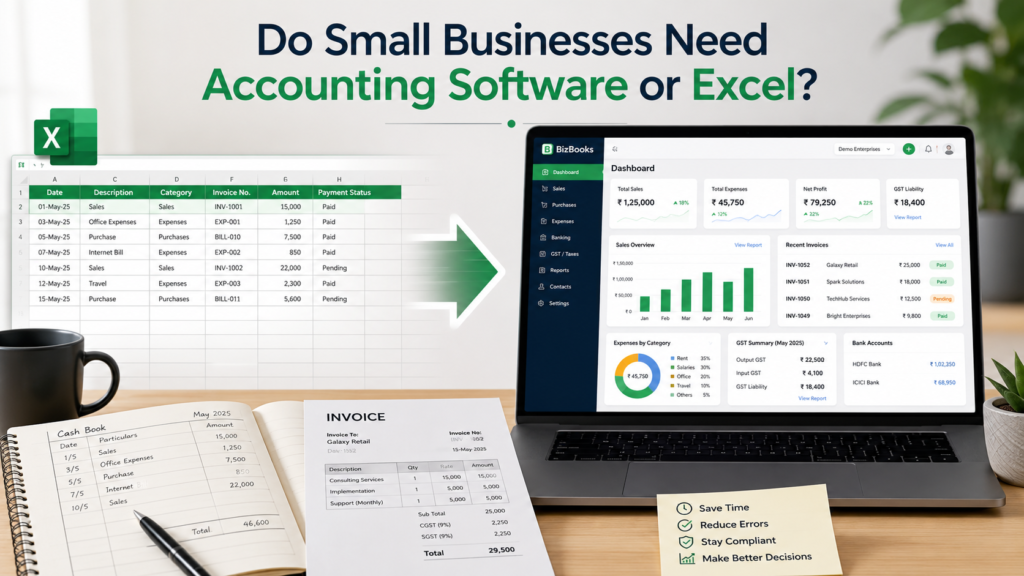
Should small businesses use accounting software or Excel? Compare both for GST billing, stock, payments, reports, CA sharing, and daily business needs.
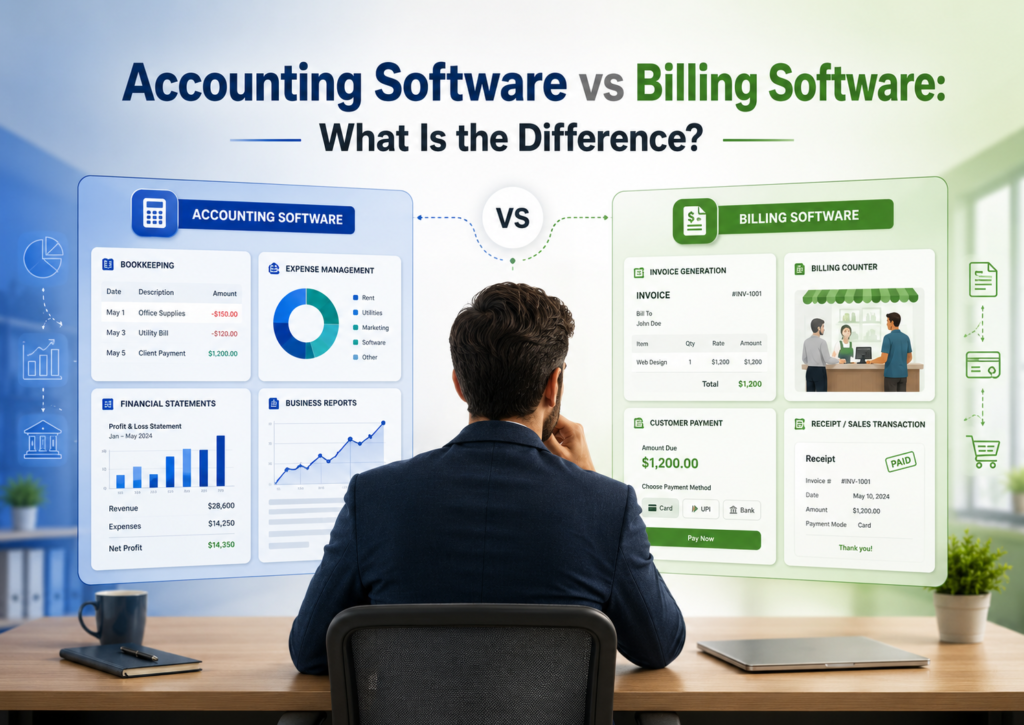
Understand the difference between accounting software and billing software, with Indian SMB examples for GST billing, inventory, payments, reports, and daily business control.
A cost sheet format is a structured way of presenting all costs involved in producing a product or providing a

What Are Intangible Assets? Intangible assets refer to non-physical assets that provide long-term value to a business. These assets can

What is Cash Flow? Cash flow refers to the movement of money into and out of a business over a

What is Capital Expenditure? Capital Expenditure (CapEx) refers to funds used by a company to acquire, upgrade, and maintain physical
What is an Income Statement? An income statement, also known as a profit and loss statement or statement of earnings,
